
OEE — Overall Equipment Effectiveness — is widely talked about in manufacturing. Unfortunately, frequently OEE isn’t measured properly. Measurements that are easy to make are often not accurate enough to make informed decisions on how well your equipment is performing or, importantly, how to improve your numbers.
AI assisted data analysis is hugely powerful but entirely dependent on the depth and quality of the inputs. Likewise the expectation to maximise production to stay competitive has increased. On a robot cell it is usually worse than elsewhere, because the robot itself is rarely monitored properly. It should be, but it is difficult to do, so the information never comes straight out of the controller. It arrives through the filter of a PLC, or through the filter of overall output, and the granular changes at robot level are never seen. With AI becoming the norm it is important to capture as much information as we can.
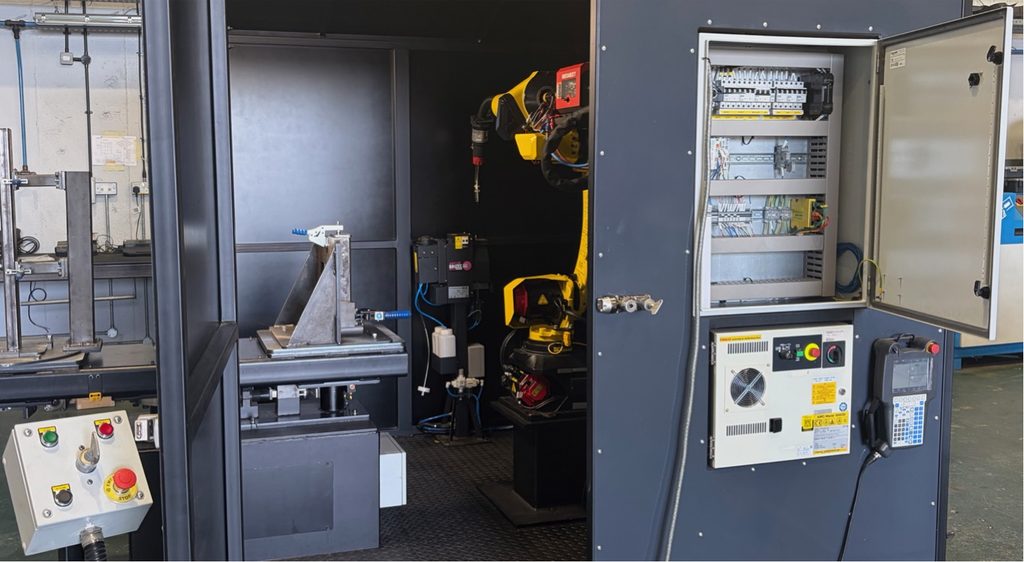
I have spent years designing, installing, programming and maintaining robot cells, and I built RoboVigil to read what the machine controller already knows. This gives us two huge advantages; greater accuracy and better understanding. This guide covers how OEE applies to a robot cell, why the figure most people have is a rough measure of output rather than a measure of the cell, and what changes when the data comes from the robot itself.
The calculations
OEE is Availability × Performance × Quality.
- Availability is run time divided by planned production time.
- Performance is ideal cycle time multiplied by total count, divided by run time.
- Quality is good parts divided by total parts.
The 85% “world-class” figure comes from Seiichi Nakajima’s work on Total Productive Maintenance, built from 90% availability, 95% performance and 99% quality. It was set for high-volume, repetitive production, so treat it as a reference rather than a target. Multiplication is what makes OEE useful: three scores of 90% give 72.9%, so a weak component cannot hide behind a strong one.
OEE as a metric is great. But you can see it is only as good as the data going in.
Why robot cells are measured badly
Getting data out of a robot controller has always been awkward. Each brand has its own interfaces, and often a paid software option before it will talk to anything outside the cell. You cannot and should not attach robots to a larger network without a huge amount of care. Most are not secure enough to do so. So the robot is monitored through the PLC, which carries whatever is needed for the system to run and not much more. That tells you the cell was down. It does not tell you why, how often, or for how long each time. Lots of data is being missed, and data is key to analysis, especially with AI.
The other route is to skip the system altogether and build the OEE figure from the outputs. Pallets built, parts welded, parts placed, divided by what the shift should have produced. That is a reasonable measure of what came out. It is no use for identifying where the losses are, and you cannot see how to improve the figures.
The losses on a robot cell are mostly small and repeated. A cobot protective-stops because a part was mis-loaded, the operator resets it, and the cell carries on. A palletiser waits for the infeed to catch up. A welding cell throws the same alarm after every third torch clean. Most of these are not long enough to be noticed let alone written down, but every one of them is in the controller.
What the controller already records
Every robot controller logs its own state and every fault, with a timestamp, far more accurately than a log sheet ever will.
- A Universal Robots cobot records the protective stop reason, robot mode and program state.
- An ABB IRC5 or OmniCore keeps an event log with error numbers and text, alongside controller state, operating mode, program execution and the speed ratio set on the pendant.
- A FANUC keeps the alarm history with the alarm code and pendant text exactly as the controller reports them.
RoboVigil reads all of that directly, with nothing installed on the robot and no software options, which is what makes monitoring at robot level easy enough to actually do. Read it directly and the availability figure stops being an estimate. The controller knows when it was running a program and when it was not, and no stop goes unrecorded because it was too short to bother with. RoboVigil automatically identifies and maps the most important metrics allowing you to set it up in seconds. Meaning there is no incentive to stick to the basics, but you can always tweak if needed to exactly suit your application.
What you see when RoboVigil is attached to a cell
Attach RoboVigil to a palletising cell or a welding cell and the picture changes within a shift or two.
- Recurring issues show up. The same alarm code fourteen times since the last tool change, or the same protective stop reason every time a particular fixture is used, is visible in the fault history rather than buried in someone’s memory.
- Small stops are recorded. Every fault, with its code, text, timestamp and a camera snapshot from the moment it happened, is kept in the fault record in the app.
- Idle time is measured. A graph shows how much of each day the robot spent in each operating state: running, idle, error, stopped. How much time it was actually producing is a number, not a guess.
- Throughput variation has a cause. Cycle-time trends per machine, line and factory show where throughput varied, and the fault and state history alongside usually shows why. On an ABB, a speed ratio turned down on the pendant and left there is visible from the app rather than found at the next service visit.
RoboVigil connects to the controller through a WireGuard VPN on your existing router, with nothing installed on the robot. When the robot faults, a push notification goes to your phone with a one-line description of the fault; the controller detail and the camera snapshot are in the fault record. For an integrator looking after cells on customer sites, that means knowing what stopped and why before the customer rings, and often telling them how to clear it without getting in the van.
Additionally the live feed of camera and data allows diagnosis of running machines. You don’t have to wait for a failure and a post mortem. You can see the play in the tooling. You can see the number of amps creeping up. The sensor reading inconsistently.
RoboVigil isn’t an OEE platform and it doesn’t measure quality. Scrap and rework still come from inspection or the operator. What RoboVigil gives you is the availability and cycle-time data taken from the robot itself, which is the data an OEE figure should be built on. The more of it there is, the more accurate the figure, and the more obvious it becomes where to put the effort to improve.
Related guides
- How to Monitor Universal Robots with RoboVigil
- How to Monitor ABB IRC5 Robots with RoboVigil
- How to Monitor ABB OmniCore Robots with RoboVigil
- How to Monitor FANUC Robots with RoboVigil
- Getting Robot Data into SCADA and MES with RoboVigil
RoboVigil costs £150 per machine per month, all in, with a 30-day free trial. Get started
OEE definitions follow the standard formulation set out at OEE.com. The 85% world-class benchmark and its component targets originate with Seiichi Nakajima’s work on Total Productive Maintenance.